Internet Data Usage Monitoring So You Don't Hit Your Data Cap

How To Monitor Internet Data Usage To Avoid Hitting Your ISP Data Cap
What Is Data Usage
I want to start this post by clarifying what data usage is.
There is confusion among people that aren’t in the IT field. That’s fine. I’ll give you a high-level overview here.
Data usage is not the same as bandwidth.
Bandwidth
Internet bandwidth is how quickly you can send (upload) or receive (download) data between a host (computer, phone, tablet…) on your network and the public internet.
When you run a speed test, it is measuring your internet bandwidth.
If you take pictures of your child doing something you think is cute, bandwidth determines how quickly you can upload to Instagram so people that don’t really care can see those pictures.
When Netflix is buffering on your iPhone while you are in the middle of the desert and your signal only has 1 bar, that is because the bandwidth has decreased. You cant download the data fast enough to watch continuously.
If you are at a large concert and you take one of those shaky portrait mode videos with the flash on for no reason, it might take a long time to post it to Twitter. This is because the network is congested and it doesn’t have enough bandwidth for everyone at the concert.
It’s similar to being on the highway in the middle of the night by yourself vs. being on the highway at rush hour when everyone is heading home after work.
You are traveling the same distance but it takes a lot longer when there is more traffic.
Data Usage
Data usage is simply the amount of data transferred.
This includes the data you are receiving (RX) and the data you are sending (TX).
When you turn on your Xbox and GTA V says there is a 4.2GB update that you need before you can play, you will incur 4.2GB of data usage (RX).
When you drop 10GB of video files into a shared Dropbox folder, you will incur 10GB of data usage (TX). Everyone else it is shared with will incur 10GB of data usage (RX) when it eventually syncs to their computer.
When you are playing a crappy video game on your phone and you agree to watch a video in exchange for pretend currency, you will incur data usage (RX) for that video.
Everything you do on the internet uses data.
The Issue
My internet service provider has a monthly internet data usage cap. That means if I use more than a certain amount of data in my billing cycle, I will be charged more money.
Cox Communications (my ISP) caps my data usage at 1024GB. If I use more than that, I am charged $10 for every additional 50GB I use.
That means if I use 2024GB (about double) I would be charged another $200 on top of the price of my regular plan.
We all know it’s bullshit scam but that’s not what this post is about.
I wanted a solution that would allow me to see how much data I’ve used so far at a glance.
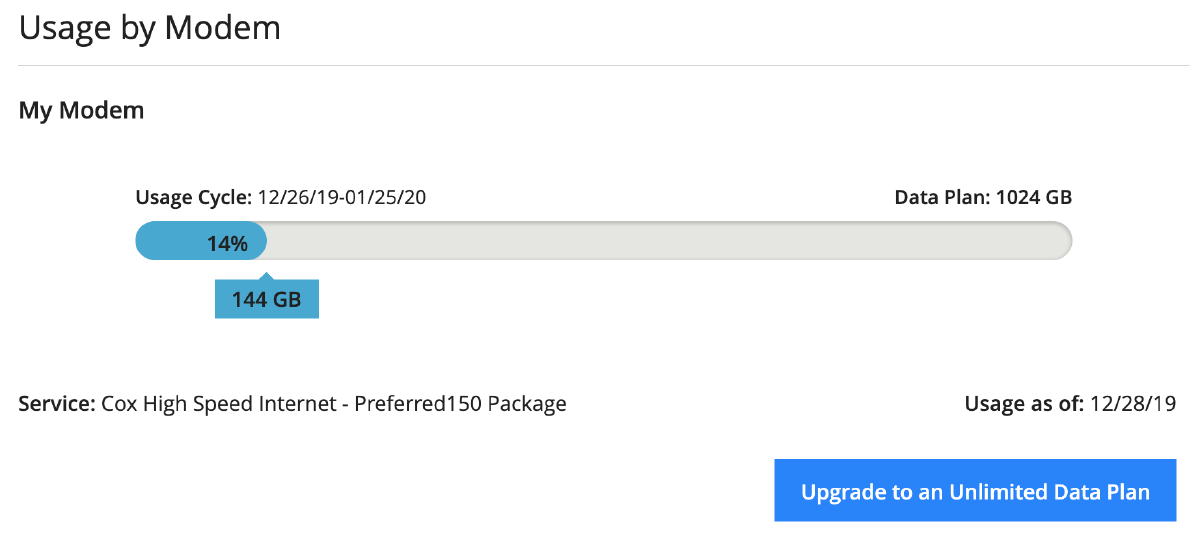
Cox internet data usage meter
Cox does have a feature on their website that allows you to see your current usage (and conveniently a button to upgrade to unlimited data for more money) for the monthly billing cycle but it’s always a day or two behind.
As you can see in the photo above, I am definitely on pace this month to go over.
I wanted a near real-time solution. I need to know if I am allowed (without being charged more) to do things like binge-watch all 5 NBA games back to back on Christmas Day while my wife has a Harry Potter marathon in the other room.
Another solution requirement was that it must be easy. I want to know at a glance and I don’t want to maintain anything to keep it working.
How We Can Monitor Internet Data Usage
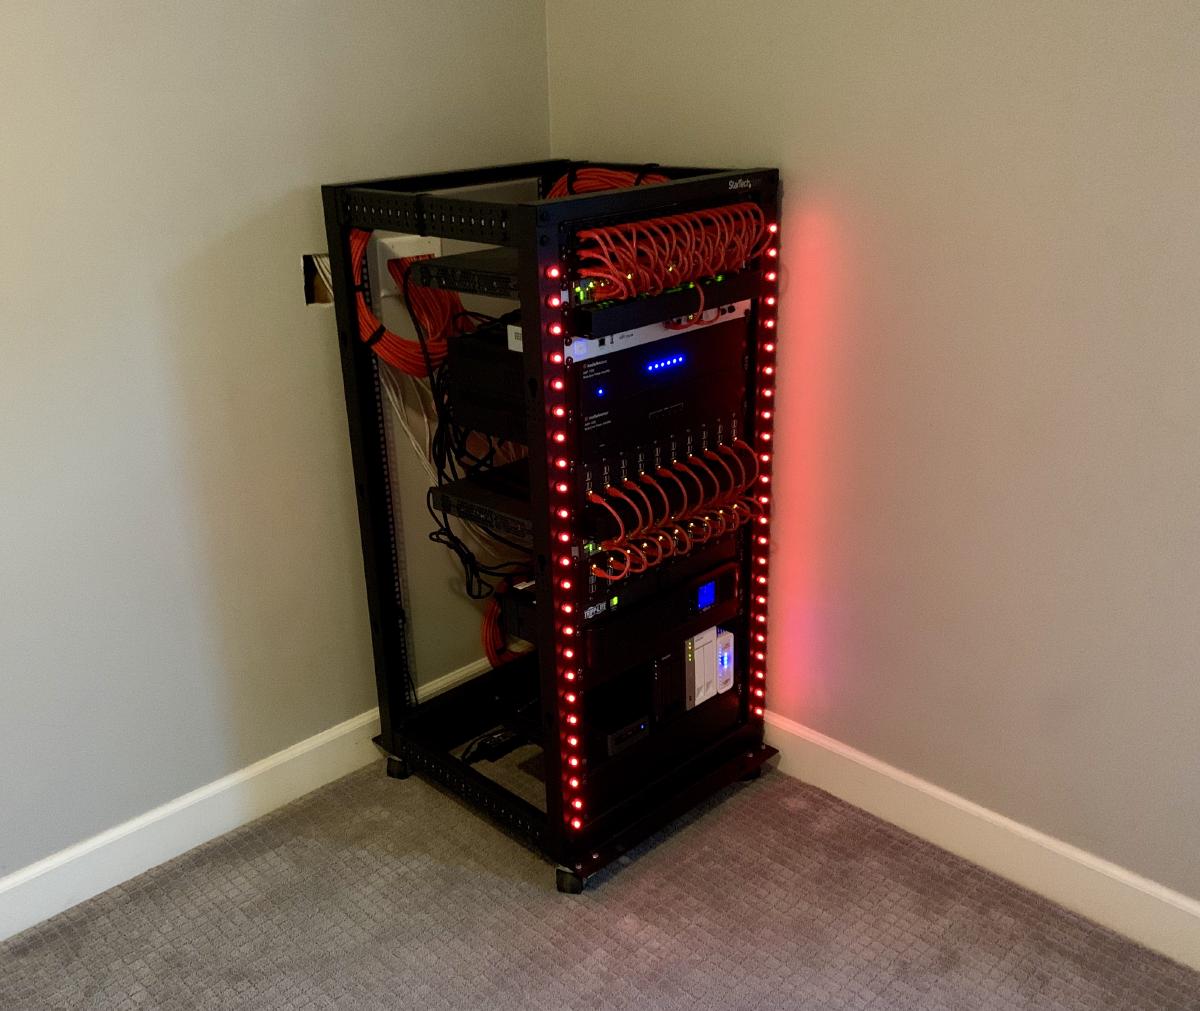
Recently I installed WS2811 LEDs in my server rack.
Even before that project was finished, I knew I wanted to use the WLED HTTP request API to manipulate the LEDs based on events happening in my homelab. This is my first project to do that.
My home router is a Ubiquiti USG PRO 4. Like a lot of networking equipment, it runs Linux at its core and Ubiquiti gives you full access to the command line.
I should be able to use the CLI to query how much data has been used on the USG WAN port and then send commands to WLED through the HTTP request API based on how much data was used.
The WAN port on the USG should count all traffic for the interface somewhere. I just had to find the best place to query that information.
Equipment Needed For Project
Other than the equipment needed for the WLED install, this is what is required.
This tutorial assumes you are using a UniFi Controller on a Raspberry Pi using Docker.
You can easily make it work if the controller is hosted somewhere else and installed a different way. I’m just letting you know what my instructions have been tested on.
| Part | Comment |
|---|---|
| Ubiquiti UniFi Security Gateway (USG) or Unifi Security Gateway Pro (USG-PRO-4) | I am personally using the USG PRO 4 but either of these will work. |
| Ubiquiti UniFi Cloud Key (UC-CK) | This is optional. If you are running your UniFi controller on a Raspberry Pi, you do not need this. |
How To Setup Internet Data Usage Monitoring
I’ll now walk you through the process to get this setup on your equipment so that you can account for every GB you use each month.
WLED
Please read getting started with WLED if you don’t have it setup already.
For this project, you will need the IP address of WLED after it is setup and confirmed working.
You can move on if you already have WLED installed and configured.
The number of LEDs in your installation shouldn’t matter. This project will work with all WLED installations.
USG
Start by logging into your Ubiquiti USG. I’ll explain first and then tell you when to start running commands.
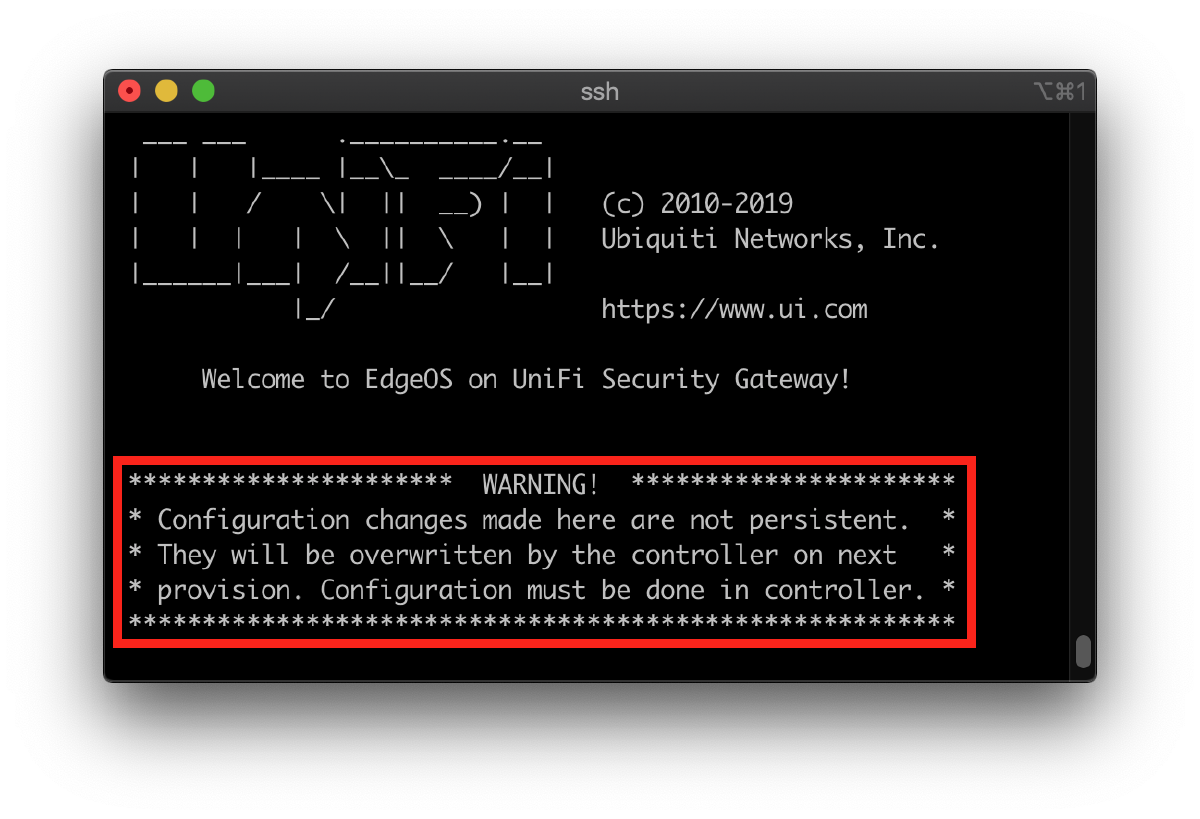
If you read login banners and MOTDs when you login like you should… you’ll notice the following warning.
Configuration changes made here are not persistent. They will be overwritten by the controller on next provision. Configuration must be done in controller.
This was my first roadblock. I needed to keep 2 scripts on the USG and I needed them to persist through provisioning, updates/upgrades, and reboots.
It turns out there is at least 1 directory that is persistent.
/config/scripts/
I could use this directory to keep my scripts safe.
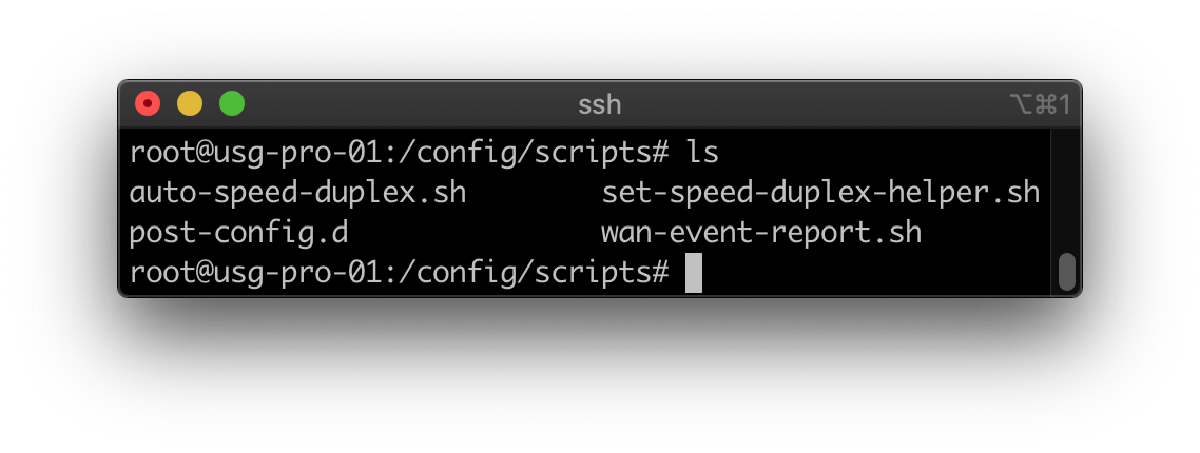
You can see that Ubiquiti already keeps some scripts here. Let’s put our own in there now.
Run the following commands to put these scripts in place.
sudo su -
cd /config/scripts/
curl -Os https://raw.githubusercontent.com/tynick/unifi_usage_wled_status/master/get_usage.sh
curl -Os https://raw.githubusercontent.com/tynick/unifi_usage_wled_status/master/reset_usage.sh
chmod 755 /config/scripts/get_usage.sh
chmod 755 /config/scripts/reset_usage.sh
The first command will move us into the /config/scripts/ directory. That is where we want our scripts to live.
The second and third command download the get_usage.sh and reset_usage.sh scripts.
The last two commands make our script executable. This allows the system to run them when we need.
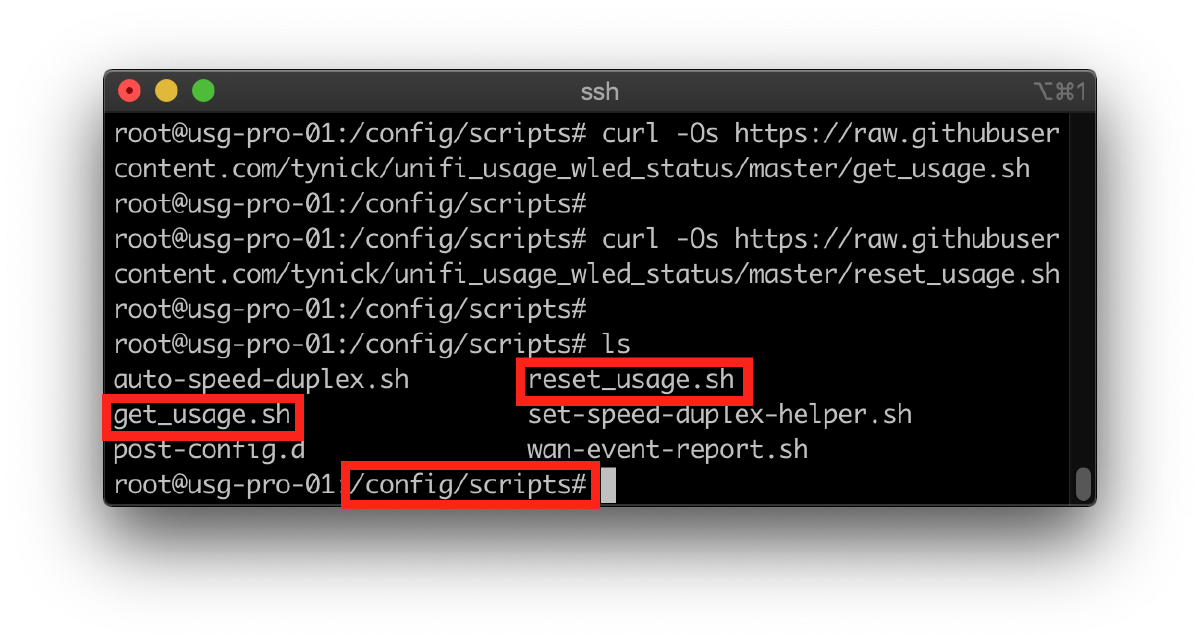
You can see that our scripts are in the proper place.
Please don’t change the filenames of these scripts unless you know what you are doing. Other parts of this project address them expecting the filenames that I have given. They must keep these names unless you understand how to change them everywhere they are used.
How The Scripts Work
get_usage.sh and reset_usage.sh are the brains that make this project work.
If you have a regular USG, you need to uncomment the interface variable in BOTH of these scripts. Simply remove the # from the line that says #interface="eth0" # USG. If you have a USG Pro, you are good to go.
Here is a high-level explanation of each…
get_usage.sh asks the USG how much data it has used since the last WAN interface counter reset. Then it tells WLED what color to change to based on how much data has been used.
Open this script and edit the following line. Make sure you point it to the IP address of your working WLED install.
# IP address of WLED node you want to control
wled_ip='192.168.1.153'
reset_usage.sh will reset the WAN interface counter. We only want this to happen when your billing cycle ends but we will get to that later.
Below is the low-level explanation. Feel free to move on to the next section if you don’t care. You shouldn’t really be running things that you don’t fully understand though…
I’m going to assume you are familiar with bash scripting and only explain the things that I think you will wonder about or question why I did it that way.
get_usage.sh
get_usage.sh isn’t a terribly complicated script but I’ll explain some of the decisions I made.
# status colors
very_bad='&A=128&FX=1&SX=245&R=255&G=0&B=0' # red flashing
bad='&A=128&FX=0&SX=0&R=255&G=0&B=0' # red
warn='&A=128&FX=0&SX=0&R=255&G=127&B=0' # orangish
ok='&A=128&FX=0&SX=0&R=255&G=255&B=0' # yellowish
good='&A=128&FX=0&SX=0&R=127&G=255&B=0' # light green
great='&A=128&FX=0&SX=0&R=0&G=255&B=0' # green
If you want to change colors or animations for different statuses, check the WLED request API documentation I linked earlier in the article.
# get total bytes from WAN interface
rx_bytes_used=$(/opt/vyatta/bin/vyatta-op-cmd-wrapper show interfaces ethernet "${interface}" | grep 'RX' -A1 | tail -1 | awk '{ print $1 }' | awk '{ gb =$1 /1024/1024/1024; print gb }')
tx_bytes_used=$(/opt/vyatta/bin/vyatta-op-cmd-wrapper show interfaces ethernet "${interface}" | grep 'TX' -A1 | tail -1 | awk '{ print $1 }' | awk '{ gb =$1 /1024/1024/1024; print gb }')
You might be wondering why I used /opt/vyatta/bin/vyatta-op-cmd-wrapper show interfaces ethernet eth2 rather than something like ifconfig eth2 to gather interface stats.
The main reason is that I need to be able to reset these counters each month at the end of a billing cycle.
ifconfig stats can really only be reset by rebooting the system or using modprobe to unload and reload the module from the kernel.
That seemed unnecessary to me.
The stats from show interfaces ethernet eth2 are independent of the ifconfig counters.
I found out that I could use UniFi CLI commands in my scripts by using the vyatta-op-cmd-wrapper script. This is much easier and safer.
# convert bytes to gigabytes. remove decimal and "round up" by 1
rx_gb_used=$(echo "${rx_bytes_used}" | cut -d \. -f 1); let rx_gb_used++
tx_gb_used=$(echo "${tx_bytes_used}" | cut -d \. -f 1); let tx_gb_used++
let "total_gb_used=rx_gb_used+tx_gb_used"
This is the best way I could figure out to calculate bytes to gigabytes. I’m completely open to changing it if you have a better and equally simple solution.
# set wled params based on total_gb_used
if [[ "${total_gb_used}" -gt 999 ]]; then
    curl "http://"${wled_ip}"/win"${very_bad}""
elif [[ "${total_gb_used}" -gt 900 ]]; then
    curl "http://"${wled_ip}"/win"${bad}""
elif [[ "${total_gb_used}" -gt 600 ]]; then
    curl "http://"${wled_ip}"/win"${warn}""
elif [[ "${total_gb_used}" -gt 400 ]]; then
    curl "http://"${wled_ip}"/win"${ok}""
elif [[ "${total_gb_used}" -gt 200 ]]; then
    curl "http://"${wled_ip}"/win"${good}""
elif [[ "${total_gb_used}" -ge 0 ]]; then
    curl "http://"${wled_ip}"/win"${great}""
fi
Yes, I am very aware of case statements. I wrote it this way because I feel like it is easier to read for humans. My favorite language is Python. I try to keep things simple and easily readable whenever I script because of that.
Not everyone that owns a UniFi device is a system or network administrator by day. The command line can be really scary for beginners. I tried to help with that.
Feel free to change the values if your internet data cap is lower or higher than 1000.
reset_usage.sh
reset_usage.sh is much shorter and doesn’t have any logic at all.
# clear interface counters
/opt/vyatta/bin/vyatta-op-cmd-wrapper clear interfaces ethernet "${interface}" counters
It’s pretty straight forward except for the last line.
Again, I needed to use this command wrapper script to run UniFi CLI operations from a script.
Now we need to figure out how to run these scripts automatically!
UniFi Controller
Normally when you need to run a script at a certain interval, you use something called cron.
Unfortunately, the crontab on a USG can be overwritten or removed during an update. So I needed to find a new way.
I found out I could use something called task-scheduler. I’m not certain if this is actually cron under the hood but it does have an option to accept cron schedule formatting.
SSH to your UniFi Controller now and let’s get this setup.
If you followed my UniFi Controller tutorial on this site, you can copy and paste all of my commands.
If not, you might have to figure out where the config.gateway.json goes. You are looking for a directory similar to <unifi base>/data/sites/<your site name>/
Mine is located at /home/pi/unifi/data/sites/default/.
I worked with someone trying to get this running on a Cloud Key and we confirmed that the directory was located at /srv/unifi/data/.
Let’s look at the contents of the file and I’ll explain what it means.
{
  "system": {
    "task-scheduler": {
      "task": {
        "get_usage": {
          "executable": {
            "path": "/config/scripts/get_usage.sh"
          },
          "interval": "1m"
        },
        "reset_usage": {
          "executable": {
            "path": "/config/scripts/reset_usage.sh"
          },
          "crontab-spec": "1 0 26 * *"
        }
      }
    }
  }
}
If you’ve never read json before it might be a little confusing. Our json file basically tells the system to use task-scheduler to add a new task two different times.
Each task has its own name. get_usage and reset_usage. After that they show the location of our scripts to be executed.
You can see that the get_usage.sh script interval is set to 1m. That tells the system to run that script every minute.
Just to clarify, once a minute the system will run the script that checks your WAN interface counters (all internet goes through here) and then changes the color of the LEDs based on the numbers it got from the WAN interface.
The most important part of this file is "crontab-spec": "1 0 26 * *". You need to change this based on what day your internet billing cycle ends.
Checkout crontab.guru to test your crontab entries.
1 0 26 * * translates to this…
at the first minute of the 0 hour of the 26th day of the month
My billing cycle ends at the end of day on the 25th of each month. That means my reset_usage.sh script will run right after the billing cycle ends.
It will clear the counters and the get_usage.sh script will then see that the counters are reset and change the LEDs accordingly.
Now run the following commands to put the file into place.
sudo su -
cd /home/pi/unifi/data/sites/default
curl -Os https://raw.githubusercontent.com/tynick/unifi_usage_wled_status/master/config.gateway.json
Our file is now in place, but our configuration isn’t working yet.
We need to tell the UniFi Controller to read this file and put them into the task-scheduler.
To do this we need to use the UniFi Controller web interface to do a Force Provision.
Note: This will cause the Unifi Controller to restart your USG!
Once logged in, go to Devices > Select your USG > Config > Manage Device > Provision.
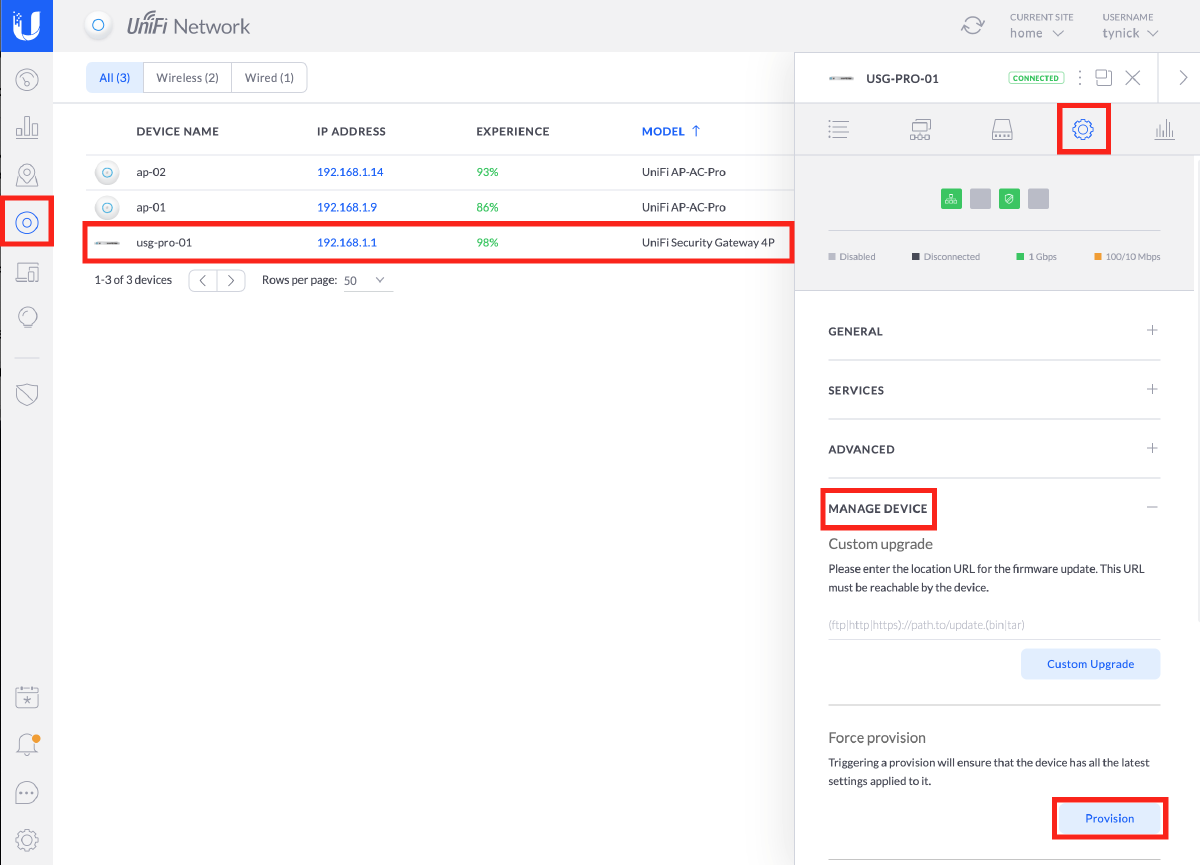
Once you click Provision, the Unifi Controller should push the configuration to the USG and then reboot it.
After your USG has restarted, login and check to see if your jobs are scheduled by running the following commands.
configure
show system task-scheduler
You should see a similar output to this…
admin@usg-pro-01:~$ configure
[edit]
admin@usg-pro-01# show system task-scheduler
 task get_usage {
     executable {
         path /config/scripts/get_usage.sh
     }
     interval 1m
 }
 task reset_usage {
     crontab-spec "1 0 26 * *"
     executable {
         path /config/scripts/reset_usage.sh
     }
 }
[edit]
admin@usg-pro-01#
Summary
It’s unfortunate that we have to monitor our internet data usage because of companies like Cox. There isn’t much I can do about that though. My solution only allows me to see where I am at to warn me before going over the data cap so I dont need to give them more money.
Your USG should be running the scripts at regular intervals now and manipulating your LEDs based on what the scripts find.
For people with a homelab that want to use this, you don’t need to RGB your entire rack.
If you have an open rack unit, grab something like this [Blank 1U Spacer](https://amzn.to/37lHdX6 “Blank 1U Space for 19” Rackmount on Amazon.com") and install some WS2811 LEDs in it.
That way you don’t need to modify your entire rack as I did.
This will allow you to glance at your server rack and have a pretty good idea of how close you are to your ISPs monthly data cap.
It’s worth noting that you don’t need a server rack to do this. You can install LEDs in anything for this project.
Shoot me a message on Twitter if you build something cool with this. I’d love to see it.
You can also follow me on Twitter or subscribe to my mailing list below if you want to be notified when I post a new article.